

Real estate reflections: What to expect in the 2nd quarter
.jpg?w=128&h=128)
Paul Reddam
Paul leverages his 25 years of experience in the Austin market to provide individuals with an unparalleled level of personal attention and responsive ...
Paul leverages his 25 years of experience in the Austin market to provide individuals with an unparalleled level of personal attention and responsive ...
Once we get past the April Fool’s Day pranks, I like to evaluate how the first quarter turned out. It’s a good barometer to gauge how Austin home sales will shape up the rest of the year. If we look at home sales inside the Central Austin loop, here’s how 2019 is shaping up so far.
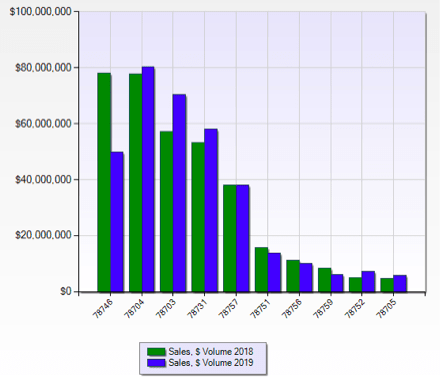
Austin’s real estate market in 2018 versus 2019
For starters, it’s useful to compare year over year sales. So far 2019 is on par with the first quarter of 2018 with one notable exception – January. This January was f-l-a-t in Central Austin. Not surprising considering that interest rates rose to almost 5% by the end of 2018. Plus it was a pretty rough Fall season with the government shutdown and uncertainty about the future. Once interest rates went back down, the Austin housing market kicked into gear and quickly caught up with last year’s performance.
How many Austin houses sold
In the first quarter of 2019, 414 homes changed hands inside the Central Austin loop. This is about the same as last year. Nothing remarkable here.
Where homes are selling in Austin
Most of the real estate transactions within the Central Austin loop this first quarter were concentrated in five zip codes:
- 78704 -- Barton Hills, Zilker, Bouldin, Travis Heights
- 78757 -- Allandale, Brentwood, Crestview, Wooten (per size of zip this might be the winner)
- 78731 – Northwest Hills, Cat Mountain, The Courtyard, Highland Park West, Parts of Allandale, Ridgelea, Oakmont
- 78703 -- Tarrytown, Clarksville, Old Enfield, Brykerwoods, Pemberton

Despite the prevailing thought that Austin real estate is going gang busters, some of the zip codes and neighborhoods had fewer homes sold in the first quarter of 2019 when compared to the first quarter of 2018. That includes:
- 78746 -- East of Highway 360 and inside the loop.
- 78751 -- Hyde Park, Northloop, Ridgetop
- 78756 -- Rosedale and Georgian Terrace, essentially East of Burnet Road
- 78759 -- Westover Hills
- 78705 -- Just North of UT
Overall, most home sales in the first quarter of 2019 occurred in 78704. Of course, it is also one of the largest Central Austin zip codes. Even with the most sales volume, sales in 78704 were slightly down in Q1 as compared 2018.
The portion of Westlake that is inside the loop and East of Highway 360 definitely felt the pinch in Q1 with the most dramatic drop in sales. Both the volume of dollars exchanged in home sales and the number of sales were down this first quarter.
Interestingly, 78703 had more home sales year over year this quarter, but it had lower total dollars in home sales.
I think this will be the trend for the rest of 2018. This is why we guided our buyers to look at the B+ neighborhoods. (See our picks for the best appreciation here.)
Price per foot
Inside the Central Austin loop, our closed price per foot average stayed about the same in January as the previous year. In February, however, we saw it lurch from $378 up to $426 a foot. Thankfully, in March we held steady at that new price level.
If you like to measure the real estate market based on price per foot, check out the year-over-year changes by zip code:
78703 is up 2.58%
78704 is up 1.2%
78731 is up 5.63%
78751 is up 6.82%
78746 is up 10.3%
78752 is up 2.44%
78756 is up 16.85%
78757 is up 7.52%
78759 is breaking even

Since 78756 and 78746 had the largest increase in price per foot, I looked for possible anomalies. I can’t explain why the larger price increase, but I can offer this insight. In 78756 there were significantly more sales in 2018 than there have been in 2019 this quarter. Also, in the first quarter of 2018 the Georgian Terrace portion of the neighborhood had more sales than the Rosedale portion where prices are higher. However in 2019 there is a more even split so far. Since there were more sales on the lower price range for that neighborhood last year and there are more sales on the more expensive end so far this year, the percentage increase is higher.
As for the portion of 78746 that is inside the loop, there were significantly more sales in the first quarter of 2018 (56 sales) versus the first quarter of 2019 (35 sales). We also saw a drop in the higher end price points. For example, the highest sale in 78746 this year so far was $3.3 Million. Yet in the 1st quarter of 2018 the highest sale was $5.5 Million, and three other homes sold for more than what we’ve seen out of 78746 so far this year. That doesn’t explain the 10.3% price per foot increase, but it is consistent with the lower sales price and lower transaction volume described above.
Pricing highs and lows
There’s usually a lot of curiosity about what the least and most expensive home sales were in a given period. For the first quarter of 2019, there was a steep variance. The least expensive single family Austin home sold inside the loop was a teardown close to the flyover at I-35 and Highway 183. It sold for $201,000.
On the other end of the spectrum, the most expensive home sold was $8,442,500. This was a beautiful 5 bedroom, 6 bathroom waterfront home with 150 feet of water frontage on a .6 acre lot plus a gorgeous pool. Oh, and it had 5 living areas and large windows to showcase the outstanding views. It was swoon worthy.
As Austin continues to face affordability challenges, I was struck by the number of homes now selling for over $1,000 per square foot. Hard to believe, right? I was curious about what you can buy for $1,000 a square foot so I did some research and compiled a collection of available properties. If you’re also curious, check out this collection. It’s worth a peak.
Price per foot over 1,000
Do you ever wonder what $1,000 per foot can get you in Austin? Take a look at these gorgeo...
Homes that didn’t sell
In reviewing the Austin real estate market it’s also important to look at what didn’t sell. There was a greater number of homes inside the Central Austin loop that didn’t sell this quarter.
January 2018: 157 homes didn’t sellJanuary 2019: 177 homes didn’t sell
February 2018: 139 homes didn’t sellFebruary 2019: 143 homes didn’t sell
March 2018: 165 homes didn’t sell March 2019: 219 homes didn’t sell
Homes fail to sell for all kinds of reasons, like being priced too high, being shop worn or not being well prepared for the market.
The most interesting change year over year
As I compared the first quarter of 2019 with the first quarter of 2018 one thing stood out. The amount of time that homes are staying on the market is down considerably. Just look at these comparisons of the average days on market (ADOM):
January 2018: 84 daysJanuary 2019: 76 days
February 2018: 90 daysFebruary 2019: 74 days
March 2018: 79 daysMarch 2019: 62 days
This year I attribute it to the government shut down. Interest rates dropped, which in turn prompted a lot of buyers to get off the fence quickly, and it resulted in a surge in activity. Fewer homes were on the market so there was more competition. In short, it felt like our busy Spring season started early.
Forecasting the remainder of 2019
So what comes next?
Now that the Fed announced that they are leaving rates alone I predict there will be less buyer fear of missing out (FOMO), and that will lead to less competition to purchase a home. Even so, with our lower inventory of available homes I think Austin will continue to experience a strong seller’s market. Demand for homes will remain high, especially in anticipation of folks moving to Austin as a result of expansions at Apple, Amazon, Facebook, Google, and the Army Futures Command.
If you want to know what these numbers mean, please reach out. We’re always happy to run scenarios for your particular property, give you candid advice about the market, or just talk real estate in general.

What Our Partnership with Compass Means to You
After 15 years of being independent, we've partnered with Compass. Their mission alig...
Our 2019 predictions for the Austin real estate market
While I don’t own a crystal ball, here's where I think Austin's real estate mark...
Essential blogs to read if you're looking to sell your home
If you're looking to put your Austin home on the market, read through these blog posts...