Our annual real estate report for Austin’s 78703 neighborhoods (2016)
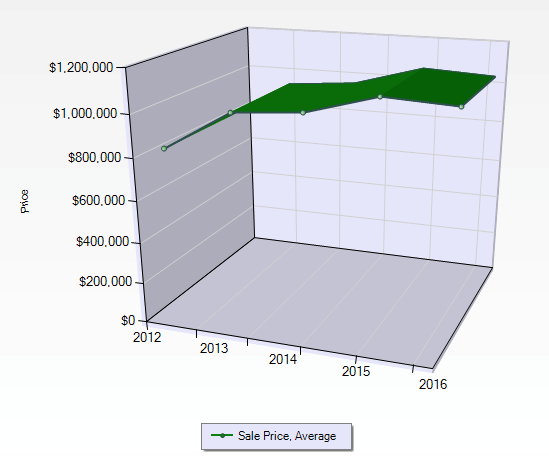
The beginning of each new year is an excellent time to take stock of your real estate values. Here we’ve offered a brief summary of last year’s 2016 home sales in the 78703 zip code, including Bryker Woods, Clarksville, Deep Eddy, Pemberton Heights, and Tarrytown. Like most parts of Central Austin, home sales in 78703 continue to rise. From 2012 to 2014 the area’s average sales price climbed from $778,000 to a little over $1 million. For the last couple of years, however, average home prices have held steady at almost $1.1 million. Given historic trends and Austin’s strong economy, we still predict another good year for 78703.
So here’s how things shaped up in 78703 during 2016:
- Out of 346 homes listed in 2016, 210 homes sold. However, 93 homes were withdrawn from the sales market and 43 expired. That means around 136 deals (39%) didn’t work out the way the seller wanted; more on that later.
- In 2016 the average sale was a 3 bedroom, 3.5 bath home with a little over 2500 square feet that sold for around $1,100,000, making the average price per foot for this area around $421. That said, fixer uppers can skew the data. If we exclude fixer uppers under $700,000, the average home was a 4 bedroom, 3.5 bath with a little more than 2800 square feet that sold for around $1,259,000, the equivalent of $429 per square foot.
- Most properties that sold for under $700,00 were fixer uppers that needed updating or significant maintenance.
- Of the 210 homes sold in 78703 last year, three of them were in the $3,200,000 range. Eleven homes sold in the $2,000,000 range.
- The most expensive home sold in 78703 last year was a tasteful Pemberton Heights estate that was updated while honoring the essence of the time period in which it was built. The sellers asked $4.5 million for the 6,000 square feet home, and it later sold for $4 million. It had 5 bedrooms, 4 full baths and 3 half baths.
- The least expensive home sold in 78703 during 2016 was a foreclosure. Bank of America asked $626,900 for the property, and it sold for a significant discount of $325,000 with no days on market. This also gives this home the distinction of having the worst list price to sales price ratio of 52%. YIKES! Get a Realtor who wants to represent you in the open market.
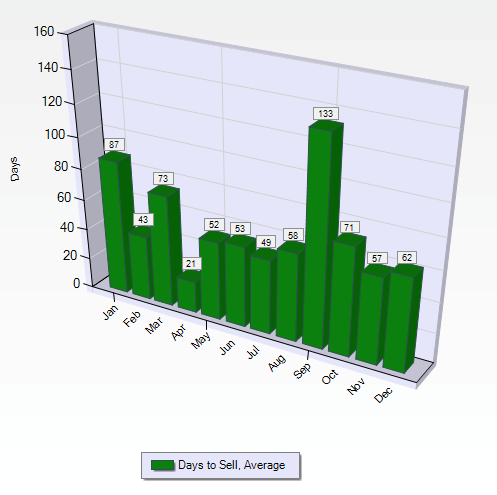
- Most homes in 78703 sold in about two months.
What stood out for me was the fact that 45 of the homes sold within 7 days; that’s pretty good, even in a hot market like ours. Homes that sold between the 5th and 7th days on the market seemed to get a better sales price than comparable listings. This was different than other Central Austin neighborhoods like Crestview and Allandale where homes that sold on the 4th day tended to net more money for the seller.
Also notable from this research was the fact that five homes sold with 0 days on market. This usually means they were sold without being put in the Realtor’s Multiple Listing Service (MLS). Remember, in times of high demand it can be to your advantage to let market competition drive prices up. Listing your home for sale in the MLS offers the property the greatest exposure because it is actively marketed to all Austin Realtors, and it is also usually automatically syndicated and displayed on third-party sites like Zillow or Trulia. Withholding a property from listing on the MLS significantly diminishes these marketing opportunities, and often does not yield the highest price for the property.
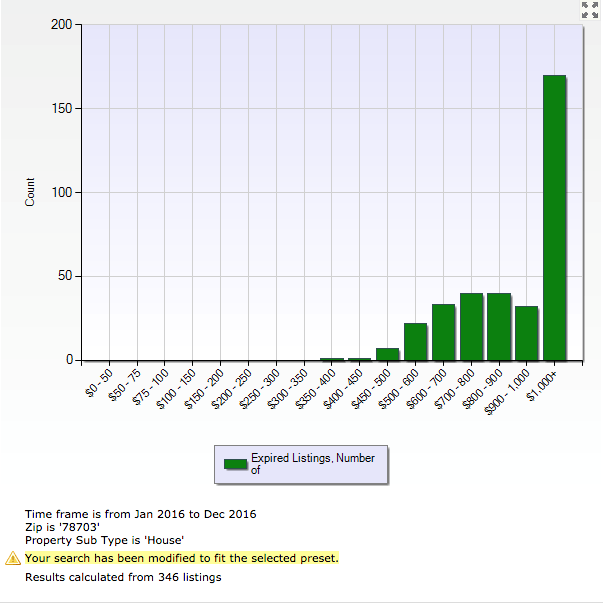
Of course, not all the homes placed on the market last year actually sold; around 39% of the listings in 78703 either expired or were taken off the market. This could be for all sorts of reasons, but we typically find that price, condition of the home, location, timing, or the marketing play a major role in getting a home sold. If we analyze the expired listing statistics for 78703, we think the data is trying to tell us something. Of course, every neighborhood will have homes that fail to sell, but as someone that has studied Central Austin real estate for over 20 years, 78703 has an unusually high percentage of homes not selling, especially compared to other Central Austin neighborhoods. If home inventory doesn’t move, you have more homes on the market competing for buyer attention. So while most of Austin is experiencing a seller’s market, the reverse is true in 78703 and that keeps appreciation flat.
The main difference appears to be price point. The majority of the homes that didn’t sell were in the million dollar price range, and in the last year or so we have been seeing a softening in the million+ market. Anecdotally, I’m also seeing buyers choose homes in 78704 instead of 78703. If you are considering selling be sure to take a look at homes for sell in competing neighborhoods – like 78704 — and make sure your home is priced as the next best deal out there by just a little. If you want to discuss how to not be one of the un-solds, let us know. You can also read our secrets to pricing homes in Central Austin at https://www.homesville.com/article/the-secret-to-pricing-homes-in-central-Austin
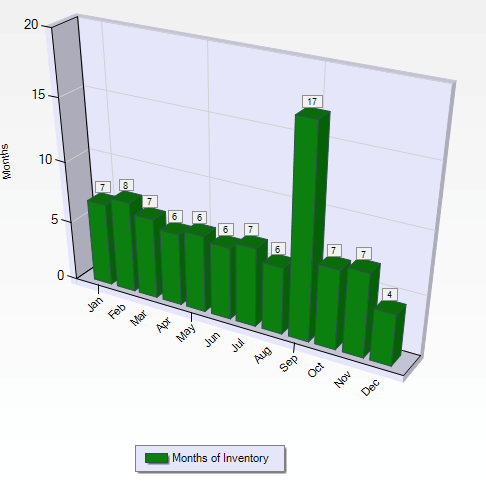
Below we’ve included some charts and statistics for those of you that like data. Keep in mind that we excluded the fixer uppers from these numbers because most people don’t live in fixer uppers, and it really skews the average data. If all this real estate talk has you curious about your own home’s value, you can get a free home valuation at https://centralaustinhomevalues.com/ No obligation, just free data.
And that in a nutshell is how the real estate market looked for homes in 78703. If you like what you read, let’s talk. I’d like to share with you the three steps that Central Austin sellers should take to optimize their sales price.





.jpg?w=128&h=128)
